Quantcast
Channel: Perforce Blog Feed
Viewing all 1361 articles
Browse latest View live

Integrated Traceability: The Secret to Surviving Your Next Software Development Audit

$
0
0
Integrated Traceability: The Secret to Surviving Your Next Software Development Audit
Thumbnail
root March 14, 2017
Traceability

Traceability has tremendous value for companies operating in any industry, but it’s critical for those in regulated industries. Regulatory bodies recognize its impact on product quality and safety, which is why traceability guidelines are included in several government regulations and international standards — FDA 21 CFR Part 820, IEC 62304, and ISO 13485, just to name a few. So for regulated industries, traceability isn’t just “nice to have” — it’s actually a regulatory requirement. Despite this fact, many companies treat it as just another item on the auditor’s checklist. A large percentage put off traceability tasks until the end of the process, and then go through the tedious, manual process of connecting all of the product artifacts and assembling a traceability matrix. They know they may have missed a few (or more), so come audit time, they cross their fingers and hope for the best. If they're “lucky,” the auditor picks the artifacts that are traced — but then they end up crossing their fingers again, hoping no undiscovered hazards are hiding in the final product. If they're not lucky, they get slapped with warning letters, delays, and the potential of some very steep fines. Building the trace matrix at the end of the development process defeats the whole goal of traceability — ensuring product quality and safety by effectively managing change. What’s more, putting it off could be costing significant amounts of time and money. If these companies implemented integrated traceability, however, they could improve product quality, cut costs, and spend far less time and effort assembling the reports auditors require.

What Is Integrated Traceability?

Integrated traceability is the ability to attain to-the-minute status information on every aspect of the product development lifecycle. Traceability links all artifacts contributing to the development of your product. It makes it easy to analyze data, generate traceability reports, and keep a weather eye on the project’s status. To be effective, integrated traceability requires the implementation of a good traceability strategy, along with a software tool like TestTrack to provide a live stream of information.

Benefits

Because integrated traceability begins when the project begins, it offers a host of benefits throughout the development process — from design reviews to risk analysis, gap analysis to verification and validation.

Design Review

Integrated traceability aids in design reviews by making it easy to understand requirements decomposition through linking. For example, marketing requirements link to product requirements, which link to system specifications.

Risk Analysis

By the same measure, integrated traceability can also aid in identifying risk-based and safety-based requirements by including risk and hazard analysis within the traceability implementation. Development teams can also identify the software code that ties to each design, technical, or software specification, making it much easier to identify high-risk code and where each requirement is implemented in the code.

Gap Analysis

Traceability also helps you identify gaps in documentation, testing, and risk analysis. Seeing these gaps enables teams to ensure they’re filled by the time an auditor comes knocking at the door. By having this information at their fingertips, they now have an easy way to provide evidence for any audits that pop up unexpectedly. This was particularly helpful for a Seapine client who arrived at his office to find he was having a surprise audit that day. Because of the confidence he had in the company’s implementation of integrated traceability, he was able to deliver information to the auditor faster, which in turn reduced the time it took for the audit. He said it was the fastest that he ever had an auditor in and out of the building.

Verification and Validation

Finally, integrated traceability helps to ensure that requirements are implemented correctly both from a verification and validation point of view. Teams can quickly make sure the requirement has been implemented correctly and the product functions for the user as intended.

Solve Problems Early

As the General Principles of Software Validation state, the vast majority of software problems can be traced to errors made during the design and development process. Integrated traceability gives development teams the power to spot problems early, so they can correct them while the cost and effort to do so is low. And as for the tedious process of assembling the trace matrix? Because they're maintaining traceability throughout the process, they can generate a matrix on demand, at any point. In TestTrack, it takes just a couple of clicks.

Learn More

An integrated traceability solution can help companies bring quality products to market more quickly, safely, and profitably. To learn how, download our white paper, 5 Ways to Bring Quality Software Products to Market Faster.

Off

Of Hashes and Clashes

$
0
0
Of Hashes and Clashes
Thumbnail
root March 30, 2017
Branching

There’s a lot in the news lately about the virtues of various hash algorithms, such as SHA1, SHA2, SHA3, and the venerable MD5.  Essentially these are wicked complex cryptography algorithms – too sophisticated for most of us to understand – that distill the contents of a file or any stream of data of any size, perhaps megabytes or more of data, into a single simple string of ASCII text characters called a hash or digest.  A hash is small, fitting easily on one line of text.  That string of text characters is absolute gobbledygook and utterly meaningless, but has one very useful purpose:  You can use it to know if the content of a file or stream of data is the same as it was the last time it was looked at.

The hope with hashing algorithms is that they’ll never “fail,” that is, that any change to file contents, even the slightest change, would result in a completely different hash.  Whenever there are two files with different content that have the same hash, that’s called a collision.

It is generally accepted that collisions occurring naturally have an insanely low probability of occurring.  However, hashes are in the news lately because some smart folks at Google have proven that Bad Guys with a ton of CPU power can artificially manufacture bad data that has the same hash as “good data,” in theory allowing Bad Guys to substitute bad content for good.

That has caused a bit of concern in the version management world, because repositories like Git and Subversion rely on hashes to verify that the contents of an entire repository are “known good stuff.”  The ability of a Bad Guy to arbitrarily compromise the hash algorithm would give them, in theory, the ability to sneak a surreptitious, corrupt repository with contents of their choosing in place of a good repository, by injecting garbage data to make the hash match.  Most experts consider it a bit of a stretch that such a replacement could occur undetected.  But regardless, developers of Git and Subversion are taking the threat seriously, and working to defend against possible attacks.  They are considering, for example, upgrading from SHA1 to other, even stronger cryptography algorithms, and contemplating detecting “collision attacks” such that they could be rejected.  Admins of these systems would need to upgrade to the latest version (once it is available) to be safer.

Though unlikely, the risk is that a Bad Guy with regular user (non-admin) access could submit a bogus file that results in a collision.

Perforce uses cryptography in a very different way from Git and Subversion, and is far less vulnerable to the risk of hash collisions.  Unlike Git and Subversion, which use a hash to represent an entire repository of files at any point in time, Perforce uses hashes sparingly, only to verify the contents of individual files.  Further, submitting bogus collision files would do nothing more than add individual junk files to the server.  Lots of pain for the Bad Guys, and no gain in terms of causing harm.  Without direct admin access to the master server machine, the ability to generate hash collisions wouldn’t benefit an attacker against a Perforce server.  That’s part of why Perforce still uses the venerable MD5 algorithm, yet is no less safe for it.  Unlike Git and Subversion, where the hash algorithms are core to the design and integrity of the entire repository, Perforce’s reliance on hashes is to guard against disk rot or network hiccups during file transfer of individual files.

With any of the version control systems mentioned here (Perforce, Git, and Subversion), a successful attack would require far more than the ability to generate collisions in whatever hashing algorithm is used.  Though the potential to damage repos has in fact been proven, improvements in those systems will make future attacks even harder, and hopefully not worth the effort.  That said, the best defense is to always have a few Good Guys who wear Black Hats, think like the Bad Guys, and help keep us all safer.

Off

Introducing Helix ALM 2017.1

$
0
0
Introducing Helix ALM 2017.1
Thumbnail
root April 26, 2017
Application Lifecycle Management

Now that Seapine is part of the Perforce family, TestTrack has been renamed Helix ALM, with a shiny new logo and some great new features. You'll see this name change in the recent release of Helix ALM 2017.1, and it affects the entire TestTrack suite:

  • TestTrack Pro is now Helix Issue Management (IM)
  • TestTrack RM is now Helix Requirements Management (RM)
  • TestTrack TCM is now Helix Test Case Management (TCM)

What’s New?

Helix ALM 2017.1 features improved integration with Helix Versioning Engine. You’ll enjoy more functionality, more flexibility, and better performance. In addition to the existing features to attach source files and work with them from Helix ALM, you can now:

  • Add Helix Versioning Engine as a source control provider.
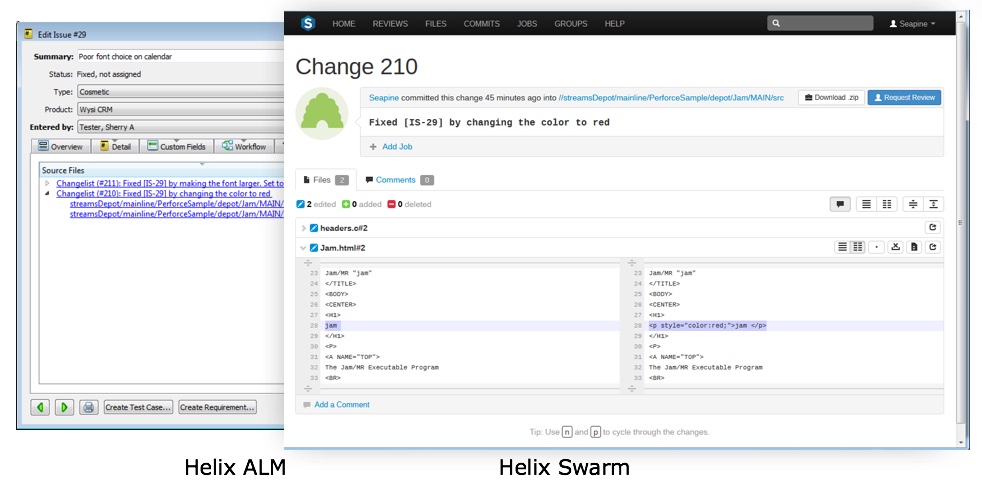
  • Attach changelists to Helix ALM items and click hyperlinks in items to view attached changelists in Helix Swarm.
  • Attach changelists to Helix ALM items when submitting them from Helix VCS clients, which requires configuring Helix Versioning Engine triggers.


Attach changelists to Helix ALM items and click hyperlinks in items to view attached changelists in Helix Swarm.


We also streamlined the process to integrate with other source control applications to get you up and running more quickly. In the last release, we introduced integration with JIRA, which lets you attach JIRA issues to Helix ALM items. Starting with 2017.1, we’re also making available the Helix ALM for JIRA add-on in the Atlassian Marketplace. With the add-on, you can see the current status of your Helix ALM tests, requirements, user stories, and issues without leaving JIRA.

See Helix ALM in Action

Watch the on-demand webinar, "What's New in Helix ALM 2017.1," to learn more about the new features and upgrades in this release.

Can’t wait? If you have a current support and maintenance plan, upgrades are free. And if you’re not already using Helix ALM, try it out today.

Off

From Bug Tracking the Macintosh Way to Helix ALM

$
0
0
From Bug Tracking the Macintosh Way to Helix ALM
Thumbnail
root May 2, 2017
Application Lifecycle Management

Let’s start at the end so you learn at least this: we have a new product name and logo for TestTrack. Yes, you read that correctly. TestTrack is now called Helix ALM, and there are similar names for the various ALM modules: Helix RM for requirements management, Helix IM for issue management, and Helix TCM for test case management. Now, don’t despair! I haven’t, and if anyone has emotional equity in TestTrack, it’s me, the father of TestTrack! But the TestTrack (er, Helix ALM) of today is not the same product I released in 1996, and I’ve always been a big proponent of renaming it to something less “Test” focused. Over the years, the descriptive name of the original product had become a detriment to marketing its other capabilities; e.g., requirements management is not “tracking testing.” Also, do you know how many people in education have thought TestTrack was a product they could use to track test scores? Helix ALM is part of the broader Perforce product portfolio. Those of you who were Seapine customers have told us how much you appreciate the seamless integration and consistent look-and-feel across the product line. We share those ideals at Perforce, so getting our brands aligned is one important step on the road to seamlessness. Over time, you will see that the products share more and more of the traits that have made them individually great. Many companies don’t take the time to make their portfolio homogenous. We do.

Logos, like people, evolve.

Products often have an unscripted life of their own. It’s interesting to watch their evolution as they go from baby, to toddler, to awkward teen, and then to become the mature person (or application) you hoped for. TestTrack has followed this arc. When I was writing the original TestTrack back in 1995, I never imagined how much it might evolve over the years. How could I? At the time, the internet was young, browsers were limited, and software development wasn’t very global. True, we considered software complex at that time, but that complexity was as much a function of the languages and technologies of the time as the problems being solved. Today, products are more complex and software may only be one part. Plus, development is distributed across cities, countries, and continents. While I dreamed of building a company around a product that could make a significant impact on software quality, how that product would evolve and the forces that would shape it were unknown.

First logo: 1996

TestTrack: Bug Tracking the Macintosh WayTestTrack 1996 logo

While I was well versed in the popular operating systems of the time when I wrote TestTrack, I was always a Mac guy at heart (a Commodore guy, if we’re talking 6502-based systems). So TestTrack was born on the Mac, and it was “Bug Tracking the Macintosh Way.” The Mac developer market being what it was in 1996 (not so great), I quickly created Windows and web-browser versions of TestTrack. This unique cross-platform market position fueled TestTrack sales, Seapine’s growth, and the evolution of TestTrack. Yes, the logo was primitive at that time, but it was also fun. That bug seemed happy to be tracked by TestTrack. In between the first and second logos, which were used for the application icons, we created more realistic bugs for the marketing material and CD-ROM cases. A few large plastic toy bugs, property of my toddler son, served as the design inspiration.

Second logo: 2001

TestTrack logo, 2001

In 2001, we retired the little green guy, refreshing the bug logo with a more high-tech look based on the red bug. It was the “digital bug” and it remained TestTrack’s logo until 2006, when we introduced the first new module in the TestTrack product family, TestTrack TCM (test case management).With a strong following by quality assurance teams, defining and managing test cases that could result in bugs being found was a natural next step for TestTrack. It also expanded our traceability story beyond change management (work items related to source code changes) to knowing where bugs came from and where the weak points were in an application.

Third logo: 2006

TestTrack logo, 2006

The release of TestTrack TCM required us to rethink the TestTrack logo. We were now building a family of products, and bug tracking was just a part of it. In 2006, the Seapine portfolio also included Surround SCM and QA Wizard Pro, so our rebranding would encompass those products as well. For its part, TestTrack received a slightly abstract treatment leveraging the two capital Ts in the name.

Third logo expansion: 2009

TestTrack ALM logo, 2009

With TestTrack managing testing, bug fixes, feature requests, and code changes, we offered a lot of visibility in middle and end of the development process. However, we couldn’t tell you “why” something was being implemented, whether the testing was truly complete, or whether risks were mitigated. Those were attributes of requirements. If we wanted to offer complete visibility and traceability, we needed to start at the beginning. So in 2009, we added requirements management (RM) to TestTrack, giving us three distinct but fully integrated modules for one complete ALM solution. We created a new logo to market the TestTrack family, using the main TestTrack logo supported by individual logos for requirements management, issue management (bug tracking), and test case management. (Why did we choose the atomic model as the symbol for RM? I’m going to have to research the answer to that question!) We never used the mini logos for the application icons, because TestTrack has always been a single executable with modules enabled by license keys. In other words, you could never just install TestTrack RM and see the weird atom icon.

Fourth logo: 2010

TestTrack logo, 2010

Not much changed with the next logo iteration in 2010. We were launching a new web site and it was high time for a rebrand across the product line. Orange had played itself out as a popular color so it was blue’s turn.

Fifth logo (Helix ALM): 2017

Helix ALM logo, 2017

Which brings us to this year. Seapine is now Perforce and TestTrack ALM is now Helix ALM. The new logo appropriately reflects the concept of a life cycle, and the colors are fresh and modern. The clean design of the new branding also fits neatly into the Perforce portfolio. And, as I noted earlier, the changes to Helix ALM are not just cosmetic. You’ll find it works more seamlessly than ever with the Helix Versioning Engine. The evolution of what started as “Bug Tracking the Macintosh Way”  continues …  

Off

What’s New in Surround SCM 2017.1

$
0
0
What’s New in Surround SCM 2017.1
Thumbnail
dborcherding May 25, 2017
Change Management

Surround SCM 2017.1 is here! This release includes some nice enhancements that you’ll want to get familiar with.

More options for reviewing files in code reviews

You now have more flexibility to see the exact changes you're interested in and how changes look when reviewing files in code reviews. You can show differences for versions not included in a review, for more information. You can also ignore case and white-space differences, change the differences output, and change the font and tab width. Learn more.    

Thumbnail
More options for code reviews

Get files with historical filenames

When getting files by label or timestamp, you can now retrieve them using the name they had when they were labeled or at the time specified by the get. Learn more.

More flexible text end-of-line formatting

Surround now supports additional file types when adding files, setting file properties, and setting server options to auto-detect or ignore files based on filename or extension:  Text (CR/LF), Text (LF), UTF-8 Text (CR/LF), and UTF-8 Text (LF).     When getting text files using the Surround SCM CLI, you can now override the default end-of-line format set in the user options. This is helpful when build scripts that run on one operating system get files used exclusively in builds for another operating system. Learn more.

Thumbnail
More flexible formatting options

And more!

This release also includes other enhancements, such as:

  • Support for the Jenkins Pipeline feature from the Surround SCM Jenkins plug-in
  • Better performance when switching branches because information is loaded in the background, allowing you to continue working
  • More options for administrators when analyzing and repairing issues in Surround SCM databases

Ready to check out Surround SCM 2017.1? If you have a current support and maintenance plan, upgrades are free. If you’re not already using Surround SCM, contact us to try it out today.

On

Helix Versioning Engine 2017.1

$
0
0
Helix Versioning Engine 2017.1
Thumbnail
jkoll May 26, 2017
Community
Continuous Delivery
Continuous Integration
Git at Scale
Scalability
Version Control
Thumbnail

Helix Versioning Engine 2017.1 Releases Now Available

Faster and Better Than Before

The Helix Versioning Engine 2017.1, released on Tuesday, features support for both Helix Core and our new Git solution, Helix4Git. Both solutions boast key improvements to performance, CI at scale, visibility, control, and day-to-day workflow efficiency.


Helix Versioning Engine supports all environments with two unique solutions:

The Helix Versioning Engine supports all teams, all environments, and all assets as the single source of truth in product development – no matter what you develop, and no matter how you do it!

  • Helix Core — our traditional, P4D functionality that you know and love – file-based versioning, granular permissions, binary asset support, etc.
  • Helix4Git — faster build processes and built-in mirroring of shared Git content — multi-repo visibility, mixed asset projects, and support for multiple Git tools.

Here’s a quick look at what’s new in Helix Core 2017.1:


Faster File Transfers? Yes, please.

Helix Core 2017.1 dramatically improves performance over high latency networks. In fact, sync and submit between servers up to 16 times faster! If that doesn’t boost your users' productivity, what will?


Introducing Helix4Git


Native Git Storage with Speed and Scale.

Helix4Git leverages our new depot type, Graph Depot, to offer users Helix functionality for stopping Git sprawl in its tracks and/or managing CI at scale — 40 to 80 percent faster builds, for example. Now, Graph Depot stores Git data natively in Helix, eliminating common scalability issues that you would encounter in other Git solutions.

*Helix4Git is licensed separately, so contact sales@perforce.com to discuss your options.

And a Whole Lot More…

  • Move files to new depot locations or branches with a single instruction — no prior editing necessary.
  • Control which TLS versions, or range of versions, the server will accept a connection from for tighter security measures.
  • Filter/Search a remote spec by name.
  • Monitor server capacities and unusual activities

For more details on the Helix Versioning Engine, visit here

To learn more about the latest release of Helix Core, including release notes, visit the What’s New page.

Want to improve your multi-repo Git environments? Try Helix4Git for free today.

Best Regards,

The Perforce Team

Off

Introducing Helix Swarm 2017.1

$
0
0
Introducing Helix Swarm 2017.1
Thumbnail
jkoll May 30, 2017
Community
Thumbnail

At Perforce, we’re going through some exciting changes. Not only did we just ribbon-cut our brand new website (please check it out) but we’re bringing a long list of exciting new features to each and every one of our development solutions.

One such solution is Helix Swarm 2017.1, our code collaboration and code review tool for the enterprise. And the Perforce team is thrilled to announce it is available for download right now. The latest release of Swarm represents a lot of hard work and close attention to the needs of our customers.

What does that mean for Swarm? It means Helix users upgrading to the latest Swarm release will have access to an enhanced collaboration product for streamlined content review and notification processes.

A Better Dashboard for Reviews

Development and design managers know the importance of fine-tuned review workflows. The longer a review waits, the greater the chance contributors are being slowed down and delayed. Or, worse still, a stagnant review brings development processes to a grinding halt — typically when a review obstruction rears its ugly head. Out of sight, out of mind.

That’s the beauty of Swarm’s new Action Item dashboards — pre-filtered, customized lists of reviews, compiled for each user to act on after login. These “Reviews to Act On” are any and all reviews that need action from a specific user. It could be a review blocking others, or it could be a high priority item, but Swarm makes sure users see it when they need to. Swarm even helps organize priority reviews in environments with thousands of review actions.

Thumbnail

Notifications Designed for You

If you were born in the last half-century and currently have a pulse, chances are you’ve experienced the frustration of a group text. The broad swath message that is initially pertinent but soon goes off the rails as other contributors add to the thread. What starts as a text to coordinate dinner reservations suddenly turns into a deluge of opinions on the latest episode of "The Walking Dead." Wouldn’t it be better if you could curate exactly the notifications that matter to you?   

Well, Swarm can’t help with group texts, but it has been specifically updated with new features to eliminate your inbox noise with notification preferences. Each Swarm user has the flexibility and control over what kind of email notifications they prefer to receive. This helps reduce the onslaught of irrelevant/non-contextual emails users may be attached to. And Swarm also adjusts to comply with organizational policy or admin guidance, allowing global notification rules to be set to satisfy audit and accountability standards.

Less noise. More harmony with Helix Swarm.

Thumbnail

Smart Email Filters

Swarm won’t tolerate an inbox loaded with opaque emails, subject-lined with “Hey!” You’re too busy for that nonsense. Swarm’s Smart Email filters enable users to receive emails from Swarm with specific headers, relevant to their project teams and their work. 

This allows users to better organize & filter specific kinds of notifications from their preferred email client, such as Outlook. Some examples on how Smart Email can be used:

  • Group all email notifications for a batch of comments, so that any new comments in that thread
  • Filter emails by notifications from specific projects (X-SWARM-Project: prj-public): e.g. move all emails that originated from a review in Swarm for project "prj-public" into the "prj-public" folder.
  • Filter emails by the review actions: e.g. move all notifications about a review getting approved into the "Approved" folder.

Markdown Format in Comments

If you’ve read this far, I’m sure I don’t have to explain Markdown to you. But as a new feature within Swarm, it’s only fair to tell you that the markup language used to style text on the web is now built into Swarm.

Users can make their comments stand out, with easy control over text rendered bold or italic, added screenshots, code blocks, or bulleted lists for clarity. Markdown support in Swarm comments provides clear and structured comments so reviewers have a better understanding of the feedback they received.

Also, Swarm can help projects stand out, too, as README.MD files are automatically rendered in the projects overview page. This helps project owners provide relevant information about their projects with a simple README.MD file update in the root of your MAIN branch. And since it’s in Helix, it will be versioned too.

Thumbnail

And There’s More…

There’s so much more that Swarm 2017.1 has to offer, including:

-Automatic changelists cleaning

-Review ownership changes

-Added support for PHP7 in P4PHP and Swarm

We’re proud of the additions because we know from our customers’ feedback that these features will go a long way to improving code review productivity and ease.

To learn more, visit our Helix Swarm page. Or join us for a live demo. Still have questions? Contact Us and we’ll be happy to chat!

Regards,

Kuntal Das,

Principal Product Manager, Perforce Software.

Off

A Day of Firsts: Adventures with XebiaLabs' XL Release

$
0
0
A Day of Firsts: Adventures with XebiaLabs' XL Release
Thumbnail
cberres May 31, 2017
Integration

Release Management tools are not something I normally look at since I am more on the development side of things than on the release and operations side. With the advent of DevOps, the communication gap between both silos is closing, and that is certainly true within Perforce itself, where I suddenly find myself responsible for the build and release of my own tools (and that is A Good Thing).

But I wear many hats these days (avoid me in a dark alleyway), and one of these hats is that of a technical marketer, which encourages me to look beyond my own realm and see what other tools have to offer. One of the tools I noticed was XebiaLabs’ XL Release, which piqued my interest since I have seen them a few times at tradeshows, often in a booth right next to Perforce. I recently found out that XL Release offers an integration to Perforce Helix.

Why Is This Important?

Perforce Helix is the version management tool of choice for a lot of the core infrastructure of the technology we take for granted, but it does not live in a world on its own: we don’t provide the whole stack from requirement to delivery (although we are starting to fill out some of the gaps, for example with Helix ALM). Instead, our customers rely on integrations with tools like build systems or release management, and it is essential that we offer these integrations and make it as easy as possible for third parties to build their own integrations as well. This is why we have a rich set of APIs from C++, Java, Python, to .Net that make accessing Perforce Helix as simple as possible.

One of the mantras of DevOps is automate, automate, automate to avoid human errors associated with manual configuration and processes. This applies to the release process as well. If I need to inform a release engineer directly or via email every time a new release is available, there is a higher likelihood that releases will be missed or information will be miscommunicated. Leveraging a tight integration between release automation from XebiaLabs’ XL Release and an enterprise version control system such as Perforce Helix, I (and others) can avoid critical issues by establishing triggered communications around release readiness.

Starting out

The idea of the integration is very simple: poll a repository for any relevant changes and trigger a potential release. To do this, you first need to configure a connection and then define a set of triggers as part of a release template that use the connection and create a release from the change.

So, when I heard that “Perforce Helix was integrated with XebiaLabs” I decided to take a closer look to see how effective the existing integration worked and determine if I should/could make any improvements, for example:


  1. Adding a connection test button to see if the supplied credentials work. The XL Release documentation taught me that a test ability can be easily added.
  2. Filtering the changes to be monitored. Perforce Helix is different from other repositories: there is typically only one server holding all files from all projects (a “Single Source of Truth”) and triggering a release for every change going into the server would be a bit... overkill?
  3. Cleaning up additional fields in the Perforce Helix shared configuration page related to HTTP Proxy configurations, which are not needed since the Perforce Helix network protocol is not based on HTTP.


I decided to dig in and find out if I could extend the tool. I was able to access the integration project in GitHub, so I forked and cloned the project and tried to understand its implementation. Turns out that XL Release is written in Java and uses Jython for scripting plugins. Although I am known as the Python guy within Perforce and have been using Java for many years, I had never actually laid a hand on Jython (Python script running in a JVM with access to Java classes), which turned out to be very simple indeed.

The integration uses P4Java, which I hadn’t used beyond simple demonstration scripts, so this was another first for me. Writing a simple test script for the “test” button was easy enough, changing the connection interface was an easy rewrite of an XML file, and soon I was up and running. I must say the XL Release architecture is very simple to extend and the interfaces are very clean. Good job XebiaLabs!

Integration Improvements

So, I was able to enhance the integration. It now sports an optional “workspace” field on the trigger page that lets users specify an existing workspace, the view of which will be used as the filter. For example, if I create a workspace called xl_release with the following view:


                  //build/scripts/...                //xl_release/scripts/...

                  //build/libraries/...              //xl_release/libraries/...


Then, only changes that affect files under the two paths //build/scripts or //build/libraries will trigger a release.

With these improvements, XebiaLabs users can now test out their connection to Perforce Helix server configuring triggers that only fire on filtered changes, thereby avoiding clutter.

Having got everything working to my liking and after updating the documentation, I embarked on my next adventure: filing a pull request on GitHub. Although I have had a GitHub account for years and have contributed to Open Source projects on other sites, I have never actually worked with someone via GitHub. Turns out the process was quite painless, even when XebiaLabs came back with a query, which required an update to my original request.

If you look at the source code you can see how little code is required to build a functional integration. Which integration would you like to build or see us build in the future?

A Day of Firsts

To sum it up, it was a day of firsts:

  • First time I used XL Release or any other release management tool
  • First time I used Jython
  • First time I used P4Java in a real project (beyond simple tests)
  • First time I built (or extended) an integration into anything but an editor (See my adventures writing a plugin using Notepad++ here.)
  • First time I filed a pull request
  • First time I had a pull request accepted

Ever felt like trying something new? Have a look and see what Perforce has to offer.

Happy hacking!

@p4sven


Off

Take Action with Helix Swarm 2017.1

$
0
0
Take Action with Helix Swarm 2017.1
Thumbnail
jkoll June 2, 2017
Community
Thumbnail

With the release of our latest upgrade to Helix Swarm, our code collaboration tool, Perforce Software is excited to offer our new, feature-rich solution to the masses. And with that, we’re highlighting some of those very features to showcase how Swarm can boost review efficiency and save your users time in their work environments.


Introducing the Action Item Dashboard

The Action Item Dashboard is a pre-filtered, customized list of pertinent reviews that is automated and curated for your authenticated users. Presented as a UI dashboard at login, the Action Item Dashboard helps manage large quantities of reviews.


Let Swarm Do the Work

In large enterprise organizations, where users work in environments with hundreds, even thousands, of concurrent review tickets, it’s imperative to close issues efficiently. Helix Swarm prepopulates a filtered list automatically at login. That means authenticated users know exactly where to start their workday.

So instead of wasting valuable time creating complicated filters from scratch, or searching aimlessly through a forest of reviews, Helix Swarm produces a personalized list of “Reviews to act on.”


Don't Block Your Team

The Action Item Dashboard ensures that users are never the cause of workflow delays. Prioritizing reviews to the top of your user dashboard, Swarm identifies all your current reviews where you are a block or obstruction.

Swarm makes it easier to keep workflow pipelines clear and manage your most pressing reviews.


Save Time & Effort

The Action Item Dashboard eliminates the unnecessary effort and time that is committed to parsing through huge libraries of open reviews.

Save your users the hassle of sorting, ordering, and searching through potentially hundreds of thousands of open reviews, getting them speedy access to the reviews they need to act on.


Supports ALL Roles

Swarm supports the project contributions of ALL users. Manage reviews that need your vote, reviews that you authored that need changes, or reviews on branches where you’re a moderator to approve or reject.

The Action Item Dashboard is a perfect productivity feature for reviewers, approvers, developers, and admins alike; if you’re participating on a review, you can handle it through Swarm.


And There's More...

Our newest release has so much to offer your product teams. Check out all the new features we’ve added at our Helix Swarm What’s New page.

Want to see Swarm in action? Sign up for a live demo with one of our technical experts who will guide you through a crash course in Helix Swarm.

Still have questions? Feel free to contact us. We’re happy to assist.

Regards,

The Perforce Team

Off

Introducing Helix4Git

$
0
0
Introducing Helix4Git
Thumbnail
jkoll June 6, 2017
Community
Git at Scale
Thumbnail

At Perforce Software, we’re always challenging our platform to grow and improve to bring better support for all product development teams, and this is no different for enterprise organizations managing Git repos at scale.

Helix4Git is our new solution for teams using Git, offering speed and scalability like no other solution.

Helix4Git enables a very flexible configuration for faster performance & scalability for a variety of use-cases that currently impede most Git environments in the enterprise world. It enables multi-repo git projects, remote mirroring of Git repos and faster builds. Simply put, Helix4Git makes Git easier.

And here’s how:

Helix4Git is excited to introduce a new type of depot, called the Graph Depot, which stands for Graph data model — the server technology that lets Helix customers store Git data natively. Users can store commits, trees, blobs, tags, and references in Helix, and that supercharges the capabilities of the Git data model, sidestepping common barriers with Git scalability. 

Graph depots can house numerous Git repos simultaneously, effectively giving Helix users multi-repo support for their Git environments. With the renowned performance and scalability of our federated architecture (edges/replicas) already built-in, Graph Depot is perfect for Git teams looking to improve speed in their CI workloads and expand their build farm’s reach.

Here’s Helix Connector for Git

So, we have our brand new shiny toy, the Graph depot for Git data, and the Helix Connector for Git is its perfect accessory.

Helix Connector for Git (aka GitConnector) serves as a remote Git server to serve Git repos stored in Graph Depot to Git clients, supporting development teams across the globe. With Helix Connector for Git, developers can seamlessly clone, pull, and push using familiar Git commands — all within stable Helix version control.

Even changes are pushed and fetched rapidly to and from the Helix server, thanks to Helix Connector for Git.

Built-In Mirroring

Helix4Git also makes life simpler for users who have their core repos stored in a pre-existing Git-server, such as GitHub or GitLab, offering a custom webhook that automatically mirrors any and all Git repo updates into Perforce.

Why is this ideal? Because users are able to build from multiple Git repos in a single workspace and take advantage of our federated architecture to unload much of your CI build burden from your Git servers to a faster, Perforce master server.

This keeps your workspace connected to your preferred CI tools, such as Jenkins, via the P4 Plugin for Jenkins. This plugin has many key advantages, including:

  • Efficiency: being able to sync a SINGLE depot of type graph that contains MANY repos
  • Hybrid support: a single depot to hold both Graph/Git data and classic Helix files at once
  • Flexibility: sync any combination of repos, branches, tags, and SHA-1 hashes
  • Automation: polling to automatically trigger a build upon updates to the workspace
  • Visibility: listing of building contents

Native Git For Native Benefits

Helix4Git is a solution for Git at scale, with sync and CI build operations up to 36% faster with less storage burden to your system.

Also, users access faster read operations (git clone, pull, and fetch) on their remote sites with the local cache of Git data stored via Helix Connector for Git

Conduct simpler and faster CI builds with p4 sync, as no other tool offered can perform the task of building off of multiple Git repos at the same time. Helix4Git makes this simple.

Harness the performance advantages of our federated architecture with Helix4Git, offering parallel build run from multiple edge servers

Want to Know More?

Our newest release has so much to offer your product teams. Check out all the new features Helix4Git can give your users.

Want to see Helix4Git in action? Sign up for a live demo with one of our technical experts who will guide you through a crash course in Helix Swarm.

Ready to get started? Download Helix4Git today!

Still have questions? Contact Us! We’re happy to help!

Regards,

The Perforce Team

Off

KinematicSoup and Perforce Dish Up Better Collaboration for Unity3D™ Developers

$
0
0
KinematicSoup and Perforce Dish Up Better Collaboration for Unity3D™ Developers
Thumbnail
cberres June 13, 2017
Integration

You know the game industry for pushing technology, hardware, and marketing to their limits. Less known is that the game industry isn’t always about the tech. At least not in the way that you might think. As release after release manages to elevate our expectations, raising the bar for studios everywhere, collaboration is the true key to bringing a game to fruition. Logically then, every title — from indie to AAA — stands to reap the rewards where advancements in tooling and collaboration software are concerned.

The key to making great software is having great talent and equally great processes in place. Source control is an area where innovators like Perforce Software have the experience to enable very efficient, refined workflows and tools.

We at KinematicSoup specialize in multiplayer games and tools, and we have created a new production tool called Scene Fusion.

Scene Fusion is a tool for Unity3D™ that we created to complement source control while drastically speeding up level design. Level designers use Scene Fusion to collaborate in real-time: They exchange every edit action with each other — and every idea — instantaneously. One of our first mandates was to ensure that Scene Fusion was entirely complementary to top-tier source control solutions, so we ensured that we were fully compatible with the Perforce Unity integration, P4Connect.

Helix Core handles long-term storage, asset, and code versioning as well as release cycle data, while Scene Fusion is used during level design to maximize designer productivity and eliminate the need to manually merge scenes, or the risk of losing work due to binary file merge issues.

Thanks to Helix Core and Scene Fusion, it is possible to adopt a compressed workflow enabling world creation work to begin even before your assets are completed. Designers working all over the world can receive new assets via Perforce on-the-fly while simultaneously collaborating on a scene in real-time.

You can see how the KinematicSoup and Perforce products complement each other in this quick demo.


Off

Version Control and Artifact Repositories: Two Pieces of the Same Puzzle

$
0
0
Version Control and Artifact Repositories: Two Pieces of the Same Puzzle
Thumbnail
cberres June 15, 2017
Continuous Delivery

Version control tools are likely some of the strongest productivity multipliers for engineering teams. Easily allowing teams of engineers to collaborate, track, and understand changes to a code base is critical for improving software quality.

Two Pieces of the Same Puzzle

Real world requirements for software grow more complex with each passing year. This additional complexity leads to larger and more complex code bases, which in turn requires specialized tools to ensure teams can safely enhance, update, and collaborate on software.

Having the ability to understand how, why, and when a piece of code changed is critical for developing a deep understanding of performance regressions, security issues, and bugs. The suite of tools offered by Perforce provide many features to help users accomplish these (and many more!) tasks safely, easily, and efficiently regardless of the size of team or code base. An accretive byproduct of this enhanced visibility is increased confidence in a team's ability to quickly iterate on software as business requirements change. This allows teams to be more effective, while enhancing their ability to track changes in software as it quickly evolves.

This increase in velocity of the software life cycle has many benefits; releasing software early and often allows a more streamlined workflow that can include customer feedback or adjustments based on changing business goals.

These changes to the software life cycle, starting at version control, have had ripple effects on other tools used in a software engineer's daily workflow. Continuous integration, static analysis, artifact storage, and deployment tools are undergoing a shift as they become more widely used and depended upon for producing software. Engineers are now relying on the integration of version control with many other tools to help increase their velocity while maintaining (or enhancing!) software quality.

Artifact storage plays a critical role in these new, fast-paced workflows and dovetails perfectly with the visibility and collaborative features that engineers have come to expect from version control tools. The packagecloud.io binary repository and artifact storage platform plays a crucial role in facilitating the visibility, deployment, and management of build artifacts by allowing engineers to quickly upload, control access to, collaborate on, and deploy artifacts from a variety of programming languages and operating environments.

Putting It All Together

A workflow that teams of Java developers can use to harness the power of the Perforce Helix Versioning Engine, continuous integration, and packagecloud.io's Maven artifact storage takes the following form:

  •   Java code is modified by the team on their workstations and reviewed.
  •   Code is submitted to the Perforce Helix server.
  •   The continuous integration (CI) service (e.g., Jenkins) polls the Helix server for updated code to build, perhaps with the Perforce Jenkins plugin.
  •   The code is built and tested by the CI service.
  •   Once the code has passed tests, a tag is added to the revision with a version string and submit to the Helix server.
  •   The build job continues by using Maven deploy to upload the Java JAR artifacts to the packagecloud.io service.
  •   The software is now ready to be rolled out to the compute infrastructure.

Benefits

This example workflow provides some very useful benefits:

  • Tests are run as new code changes are made, so bugs can be caught early by automated tests.
  • The exact revision from which a new object will be built is marked with a tag. This allows a developer to easily compare changes between two builds to assist in locating performance regressions or bugs.
  • A build artifact with a matching version string is produced. This allows a developer to link build artifacts back to source code from which they were generated.
  • The build artifacts are stored in an artifact storage service (e.g., packagecloud.io) with Maven. This allows for easy deployment of new software to compute infrastructure and also allows for easy rollback: a developer can simply change the version number they wish to deploy to rollback to a previous build artifact.

This example workflow allows teams to increase the velocity of their software development life cycle while enhancing quality and visibility.

The ability to track the evolution of changes to software is critical for building faster, and more efficient software. Likewise, the ability to easily push updates, roll back a deployment, or synchronize internal infrastructure and software services, is critical for maintaining a healthy rapid release software life cycle.


Joe Damato

CEO

packagecloud.io

Off

DevOps Digest 501: Flavors of Continuous Delivery, Part 1

$
0
0
DevOps Digest 501: Flavors of Continuous Delivery, Part 1
Thumbnail
cberres June 20, 2017
DevOps

We've arrived at the final challenge for building out our DevOps pipeline. If we think of Continuous Integration (CI) as a forge, shaping and building our product, and Continuous Testing (CT) as the craftsman’s eye, lovingly validating each step, then we can appreciate the hard-won truth of Continuous Delivery (CD) as the pointy end of the resulting sword.

Bluntly put, CD is what ultimately puts your product into your customers’ hands, and if you do it wrong somebody is going to get hurt — likely at both ends. CD is as much an art as a science: you’ve got to get your release cadence just right.

It would be nice if we could offer you a one-size-fits-all Big Box o’ CD solution, but we can’t. Nobody can. So in parts 1 and 2 of this section, we’ll offer up a handful of tools for you to hone your processes.

Puppet

Our first tool is Puppet, the oldest and most venerable option, with both free and enterprise options available. It’s worth giving serious consideration for that reason alone, to say nothing of how it essentially defined the shape of modern infrastructure management tools.

In the Puppet vernacular, an agent is installed on each node needing to be managed. (Here, “node” refers to any device that requires management as part of a computing infrastructure including web/other servers, client workstations, virtual machines of any sort, or even mobile devices.) The agent then communicates with a master to receive configuration information and reports its successes and/or failures back to said master. This architecture can serve the needs of numerous nodes with a single master, or even multiple masters, though coordination grows progressively trickier as you scale.

Puppet was intended to be a cross-platform solution, so its configuration details are specified in terms of resources, rather than platform-specific scripts. A resource has a type, name, and a set of properties that need to be configured. Its language is both a Ruby adaptation and declarative in nature, so here is a sample resource definition:

user { ‘jwilliston’ :      ensure      => present,      comment     =>‘The new guy, don’t trust his code’,      gid         => developers,      shell       =>‘/bin/bash’,      home        =>‘/var/tmp’}


This defines a resource of type ‘user’, whose name is ‘jwilliston’, and must have the set of properties that follow. Any Puppet agent receiving this will ensure that the specified properties are set accordingly as it creates this user. This is only one of the built-in resource types available with Puppet, and you can also create your own. For more details, visit the Puppet Resource Type page.

Additionally, Puppet manages resource dependencies. The master builds out a catalog of resources to be installed, which also specifies their proper order of installation. This way, users only need worry about top-level details, like wanting a node to be a web server, and can leave Puppet to ensure that the lower-level stuff for said web server will be there when needed.

And Puppet is available for just about any platform you’re likely to be using. It does, however, lack any built-in facility to “push” changes to nodes, though third-party options exist. That may not be a big deal, particularly insofar as you can set the agent polling time for however responsive you need your systems to be.

Pros and cons aside, Puppet’s particular cross-platform “flavor” is probably system-level scripting. This is because advanced tasks can still require substantial input at the command line. Nevertheless, Puppet is a mature, stable choice with a solid web user interface for reviewing and managing many nodes.

Chef

If Puppet “tastes” like system-level scripting, then our next tool, Chef, resembles a higher-level, all-you-can-eat buffet table, where you’ll spend some time getting what you what. This is because Chef is extremely flexible, can be complicated to set up, and has a non-trivial learning curve.

The whole Chef approach is architecturally similar to Puppet but clothes itself in a set of cooking metaphors. The notion of resources is there, just at a lower level. Chef resources are the building blocks of recipes, which define everything required to configure some aspect of a node.

Recipes are stored in cookbooks, the fundamental unit for communicating configuration information. Cookbooks are aimed at fulfilling a particular set of requirements and are (unsurprisingly?) found at supermarkets, including the Chef’sofficial one.

There you’ll find many cookbooks geared toward installing and configuring a particular piece of software, though you’ll also find task-oriented cookbooks for configuring a piece of software in a particular way.

Finally, Chef administrators rely on a knife, a command-line utility that can manage cookbooks and recipes, set up whole environments, and even forcibly provision new nodes remotely.

The knife tool even lets you assign high-level roles to nodes, roles being defined in terms of things to do, called run-lists, and the data required to do those things, called attributes — which themselves can be simple properties, “data bags” (chef-specific JSON) of properties, and more. Roles can depend upon other roles and specify recipes to be run, parameters to be used relative to a particular node, etc. They comprise the few bits of Chef that don’t sound like they belong in a kitchen.

As high-level as Chef can initially seem, at some point you’re going to get your hands dirty. At that point, it’ll be time to polish up your Ruby skills. A salient difference between Puppet and Chef is that Chef is aimed at developers, insofar as it lets you get away with anything you can accomplish in Ruby — including support for test-driven development (TDD) tools. The mantra “infrastructure as code” comes to mind.

With Chef, you’re less likely to run into infrastructure management needs at a scale it can’t handle, but you’re going to have to devote more time and energy to take advantage of its power. But if you’re already familiar with Puppet, or even system-level scripting generally, you might find yourself drawn to the more elegant mechanisms of Chef, which include completely open-source analytics and node management web interface, a fact worth pointing out in distinction to Puppet as well.

Next week, we’ll round out our final chapter by exploring two other CD tools that you could use: SaltStack and Ansible.


See you next Tuesday!

John Williston

Off

DevOps Digest 502: Flavors of Continuous Delivery, Part 2

$
0
0
DevOps Digest 502: Flavors of Continuous Delivery, Part 2
Thumbnail
cberres June 27, 2017
DevOps

As with many other common goals that unite us in our path toward DevOps, there is no one-size-fits-all solution for you to simply plug and go when it comes to Continuous Delivery. In DevOps Digest 501, we covered the pros and cons of using the ever popular server configuration management tools Puppet and Chef. This week, we round out that list with SaltStack and Ansible so that you might go forth and conquer the ins and outs of Continuous Delivery.


SaltStack

Salt’s original raison d’être was to enable the sort of “push” model upon which neither Puppet nor Chef were built. It still retains that “push” focus, but it has subsequently grown into a significant open source software variant as well as one aimed at the enterprise.

Unlike the other tools we’ve considered, it is implemented in Python, which makes it more accessible, due to the language’s popularity. And while Salt’s focus is clearly on “push” mechanics, it offers support for the “pull” model as well and includes something Puppet and Chef don’t: the ability to work without an agent installed.

Running without an agent requires support for remote execution, of course, and that can be a significant security concern. But if you’re already sold on the benefits of remote execution, not having an agent to install on every node can be very useful in a variety of circumstances.

Salt masters can control other Salt masters, and interestingly its agent can control multiple other agents, amusingly called minions in this use case, through a peer-to-peer interface unique to Salt. This lends a somewhat different flavor to Salt. Suffice it to say you’ve got more options for orchestration and control than with many other tools.

Salt’s installation process isn’t smooth, and I found its documentation wanting a bit. Its web interface is underwhelming (We’ve heard the enterprise edition has a nicer UI, although it comes at a cost.) Salt’s support for non-Linux operating systems is not quite where it needs to be. In short, the solution isn’t as mature as Puppet or Chef.

Yet on the other hand, its nicely consistent YAML syntax and Python scripting make it a simpler learning curve, especially for folks already familiar with Linux. And given the growing popularity of Linux distributions for DevOps automation, that’s not a bad thing at all.

In short, if you require the responsiveness of a “push” model and don’t mind a few rough edges, you might want to give Salt a look before as you consider your options. It’s hard to say where Salt is going to be in a decade, but it’s definitely not going away any time soon.


Ansible

The last tool on our list, Ansible, has a more minimalist focus, and its vernacular is more sports-oriented, given that playbooks are its configuration unit for specifying the details of configuration.

Ansible, like Salt, uses YAML in its playbooks. Its inventory configuration, which describes the nodes it manages, is in the similar but even simpler *.ini file format. In short, much of the information with which you’ll be working in Ansible isn’t going to require knowledge of any particular programming language.

Having said that, however, Ansible does require SSH and the Python interpreter on its nodes, much like Salt’s agent-less operation. You won’t need a computer science degree to get Ansible up and running, but you should expect to spend some time mastering its intricacies.

This is especially true if you’re supporting multiple platforms. Because while Ansible can support multiple platforms, the details of its playbooks and templates, which provide the structure of files to be used for configuration with placeholder values to be replaced at run-time, can be problematic. In short, if you’re trying to support multiple platforms with Ansible, you’re going to be spending some time coming up with a (or embracing an existing) set of best practices.

Perhaps the greatest benefit of Ansible is that your infrastructure management will have a relatively low barrier to entry:  you’ll enjoy support for both “push” and “pull” models, and Ansible doesn’t have any notion of an agent. This makes initial setup a comparative breeze. You’ll be sacrificing some of the control other systems offer, but if your needs are relatively few and you prefer to use the simplest tool for the job, then Ansible just might be the right choice.

Ansible is owned by RedHat, and is very popular among RHEL licensees with many servers. There is well-documented support for AWS cloud infrastructure within Ansible, although AWS has an increasingly popular built-in infrastructure management solution of their own — CloudFormation. If your needs involve a lots of RHEL VMs in a hybrid cloud/enterprise data center environment, then Ansible may be the best choice for you.


A Solid Foundation

Our hope is that this has been a good intro, for those who are investigating their options for implementing this category of tools. No matter which of these popular tools you choose, Perforce Helix can help you manage your Puppet scripts, Chef cookbooks, Ansible playbooks, and Salt scripts and data.

In fact, Helix can store far more than just your configuration data. Helix is the only version control system that can reliably store and manage far larger content, such as Docker images and even full virtual machine templates. So regardless of your CD needs, Helix provides a solid foundation on which to build. Integrations are available for all of these tools in various forms.


We’ll be back after the week of 4th of July with to leave you with few final words of wisdom.

John Williston


Off

JIRA Integration with Helix ALM

$
0
0
JIRA Integration with Helix ALM
Thumbnail
dborcherding June 28, 2017
Integration

Many organizations today use a variety of application lifecycle (ALM) management tools to help support the delivery of projects both large and small. In many instances, the tools used are selected by the individual project teams and this can cause some integration bottlenecks when the overall organization needs to have a global view of all tasks, tests, requirements, bugs, and versions across the complete product lifecycle.

Atlassian’s JIRA is one of the tools many developers like to use for issue tracking but, JIRA does not cover the whole development lifecycle on its own. For those teams that use JIRA but would like to integrate their JIRA issues with their test cases and requirements, Helix ALM (formerly TestTrack) now offers a new JIRA add that will allow you to do just that.

JIRA within Helix ALM

In Helix ALM 2017.1, we improved the out-of-the-box integration with JIRA, and introduced the Helix ALM for JIRA add-on (more on that in a minute). Helix ALM’s JIRA integration allows you to work inside of Helix ALM and, with the click of a button, create a new JIRA item or link to an existing item in JIRA. This is a many-to-many relationship, so you can create and link as many items as you need.

These two images show an example of Helix ALM with the JIRA integration enabled:

Thumbnail
Thumbnail


Helix ALM within JIRA

Now, about that add-on I mentioned. If you work in JIRA, you can also use our free Helix ALM for JIRA add-on — available from the Atlassian store — to see your linked Helix ALM items. With the add-on installed, you can simply click a link to work on your Helix ALM items. without leaving JIRA.

With our JIRA integration and Helix ALM for JIRA add-on, users of both tools can work in the environment they prefer.

This image shows an example of JIRA with the Helix ALM for JIRA add-on enabled:

Thumbnail

All Types Welcome

So what type of Helix ALM and JIRA items can use this integration? The short answer: all of them.

You can create a JIRA item from any item type in Helix ALM. Have a failed test and would like to log a bug in JIRA? You can now do that using this integration. Need the stronger requirements management features in Helix ALM, but want to create your tasks in JIRA from your requirements? You can also do that using this integration.

In fact, you can now create or link a JIRA item from any item in Helix ALM — issue, test case, test run, requirement, requirements document. The JIRA add-on for Helix ALM means that you can see the linked Helix ALM items from any item type in JIRA.

Get Started

Ready to get this up and running? Good news! This is part of the Helix ALM 2017.1 release, so for Helix ALM users, you just have to upgrade to the 2017.1 release. That’s it! NO extra costs, no extra installations — it just works.

You will, however, need to enable the integration and setup your field mappings. To make this as easy as possible, we created a short video.  

To get the free add-on, go to the Atlassian marketplace and search for Helix ALM, or click here to go directly to the add-on. The Helix ALM for JIRA add-on supports JIRA server 7.x.x and newer. After downloading the add-on, log into your JIRA instance as an admin user, click on Add-Ons, and locate “Helix ALM for JIRA.” Then click Install to install your add-on, and you are all done.

If you would like to view our complete guide to using this new integration, you can click here to view our online help.

Nico Krüger


On

DevOps Digest: Conclusion

$
0
0
DevOps Digest: Conclusion
Thumbnail
cberres July 11, 2017
DevOps

For those of you who have been following the DevOps Digest for the last year, we hope you’ve enjoyed the series as much as we have enjoyed working with (and writing about) this incredibly important topic.

We’ve built specific machinery to illustrate Continuous Integration (CI) techniques, and we’ve covered the most important strategies and tools for Continuous Testing (CT) and Continuous Delivery (CD). The path hasn’t always been easy, but hopefully you’ve found some shiny nuggets worth mining along the way.

Maybe it’s a little late in the summer for the commencement analogy, but let’s run with it anyway. As milestones go, we’ve now reached the end of this series. We’re graduating. It’s not the end, it’s the beginning. The subject of DevOps will continue to be a central topic for us, because it’s become an indispensable part of our customer’s product development workflows.

Perforce Helix has been transparently working in the background during this series, as it often is in our customers’ many and varied processes.  But let’s not take it for granted; you can’t achieve the benefits of automated testing, continuous integration, and automated deployment without having a robust version control system that supports all production artifacts. Helix is uniquely suited to fulfill this role.

DevOps has a blockbuster value proposition for small and large organizations alike, but the larger your organization and/or your product portfolio, the more you will benefit. DevOps allows teams to significantly reduce deployment pain while increasing performance and decreasing change failure rates.

Helix scales, and so do the benefits. Companies with large numbers of developers, multiple geographic locations, lots of repos, and lots of files — including artifacts, dependencies, large graphic arts files, movies, and sound — stand the most to gain. You won’t outgrow it, and in many cases it will simplify your workflow by allowing you to eliminate the need for multiple systems.

Thank you for giving us some of your valuable time by reading this series. In the constantly changing DevOps world, we can expect a lot of exciting new technologies and processes to emerge in the near future. We will continue to explore these topics here. Although we’re at the end of this series, it is truly the beginning, the commencement. Stay tuned for more!


John Williston

Off

A Powerful “Early Warning” System for Salesforce Developers with AutoRABIT and Perforce

$
0
0
A Powerful “Early Warning” System for Salesforce Developers with AutoRABIT and Perforce
Thumbnail
jkoll August 7, 2017
Partner
Thumbnail

Niranjan Gattupalli – Sr. Director of Customer Success

Salesforce has become omnipresent across industries for customer relationship management, which can be customized to a company’s individual requirements for a 360-degree view of its customers. The increasing demand for Salesforce has brought in the need for more sophisticated functionalities for developers to create and deploy applications faster with higher quality to meet the business expectations.

AutoRABIT is an end-to-end continuous delivery and release management suite for Salesforce applications with unique capabilities for version control, metadata deployments, Continuous Integration (CI), data migration, and test automation.

The Perforce Helix Development platform, with Version Control System (VCS) and Application Lifecycle Management (ALM) integration built-in, has been a great choice for development teams with design needs surrounding compliance and stability.

Here are the major challenges of Salesforce teams while trying to achieve CI with version control:

  • Lack of knowledge about using version control along with best practices for the teams coming from a “point-and-click” environment like Salesforce.
  • Delayed releases due to deployment failures caused by missing dependencies as well as code coverage issues.
  • Salesforce complex metadata structure that causes issues with profiles and custom labels.


How do Salesforce developers benefit with AutoRABIT and Helix together?

The Helix development platform has been a preferred choice for developers with some unique offerings in the space of version control and ALM as listed below:

  • Integrated ALM

Control, visibility, and traceability of the entire development process

  • Fast and Scalable, Everywhere

Federated architecture supports thousands of global users and millions of daily transactions

  • Single Source of Truth

One repository contains contributions from all teams and all artifacts from planning process

  • Security and Compliance

Granular permissions; end-to-end visibility; auditability and traceability.


AutoRABIT Check-in Editor for Helix VCS

AutoRABIT has a powerful check-in editor which is unique for Salesforce developers to check in code/configurations to Helix VCS repos effortlessly. The key features of check-in editor include:

  • Ability to understand Salesforce metadata: The editor understands the Salesforce metadata structure, can fetch the changes done by a user (up to the child metadata level) along with dependencies, and the developer can push the changes to Helix VCS. For example, a user modifies a custom field, AutoRABIT allows the user to only check in the custom field irrespective of other changes done in the custom object in the Sandbox.
  • Smart Profile Check-ins:Checking in code to VCS from the Force.com integrated development environment (IDE) would commit the entire profile to version control pushing several unwanted permissions modified in the Org causing inconsistencies when the profiles are deployed to other environments.

    It is the reason why 60-70 percent of even matured Salesforce teams who use version control and CI still do not favor including profiles into version control and CI deployments. With AutoRABIT checking in a profile along with other metadata will ensure only the permissions of respective metadata are checked in.

  • Tag Check-ins to Helix ALM work items: The developer can check in changes to Helix VCS by associating the check-ins to Helix ALM work items so that there is higher degree of traceability and collaboration for the work items.


AutoRABIT Check-in gate for Helix VCS

AutoRABIT has a powerful check-in gate that ensures developers check in only high-quality code to Helix VCS. It offers two features that can be utilized to confirm whether the code quality is maintained:

  • Validation reports for the check-in:With AutoRABIT check-in gate, Salesforce developers can verify if the code is deployable, the code has not introduced any new coding violations and is meeting the code-coverage benchmarks before checking-in the code.
  • Approval process:The extensive validation reports will be notified to the reviewer. Based on whether the approver can approve or reject the check-in, the developer can push the changes to version control.


“No Deployment strategy” for Helix ALM work items

AutoRABIT has powerful deployment capabilities that let you deploy metadata changes from either version control repos or from a Salesforce Sandbox to a destination Salesforce environment.

With AutoRABIT, a developer can deploy changes from Helix VCS repos into Salesforce based on Helix ALM work item status.

For example, an AutoRABIT CI job can continuously deploy all the Helix ALM work items which are in “ready for QA” status into QA environment.

It is effectively a “No Deployment for Release Managers” since AutoRABIT can track the user story/work item status and deploy the changes automatically into Salesforce environments based on the workflows defined in Helix ALM.

With its powerful check-in editor, which reduces the complexity of code check-ins to version control as well as continuous validation of check-ins, AutoRABIT and Helix product development ensure great quality of code and reduced deployment failures to accelerate developer productivity and release velocity.


Conclusion

AutoRABIT check-in gate for Helix serving as an “early warning” system enables Salesforce developers to check-in quality code that meets enterprise coding standards. With a powerful deployment module in AutoRABIT that deploys code changes from Helix VCS, either from a stream or from a Helix ALM work item, Salesforce release management teams can experience continuous delivery of their applications.

Off

Code Review Performance at Scale Reaches New Levels with Helix Swarm 2017.2

$
0
0
Code Review Performance at Scale Reaches New Levels with Helix Swarm 2017.2
Thumbnail
jkoll August 11, 2017
Performance
Scalability
Thumbnail

Chuck Gehman, Technical Marketing Engineer

The last few releases of Helix Swarm have been loaded with new functionality. If you’ve been putting off installing the upgrades, now is a great time to do so! The new 2017.2 release delivers new levels of performance and, as a result, improves developer and reviewer productivity.

As a browser-based user interface, Swarm has always provided great performance for code reviews. The goal has always been to load reviews instantaneously. But as the dimensions of developer seats, size of files and number of files have increased for many customers, we’ve seen this goal challenged.

Our customers consistently push Swarm in their code review workflows because they know it’s the one solution that can scale to their demands. Customers receive better performance and scale from Swarm’s code collaboration features while Helix maintains a long-term roadmap for Swarm, improving the already fast code collaboration solution.

With Helix Swarm 2017.2, the speed at which reviews are delivered to the user’s browser has been dramatically improved. Loading 100,000 reviews now takes about 1 second to display, compared to about 15 seconds prior. This is a 14X improvement!

That may seem like an insane number, but Helix customers routinely approach similarly staggering figures in their open review indexes. One particular customer manages more than 185,000 open reviews from a single Swarm instance, and they are not alone at this level of activity. To put this into perspective, we know of no competitor who sees this kind of volume—for example, one particularly popular open source project manages less than 1,000 open merge requests.

A new interface enhancement provides Swarm admins a setting that lets you configure the number of files the user can open at one time, preventing loading waits and reducing the risk that an extremely large number of files will push the browser’s performance and memory limits.

To speed interface performance with very large files, we’ve added the ability for Swarm admins to set file size and diff limits to match the needs of their users. With this setting in place, only part of the very large file will be shown in the browser (up to the limit), and then, only when needed, the user can simply click to load and view the rest of the file.

The other thing you’ll notice in the new release is cosmetic changes to reflect new Perforce branding and color schemes, to match the suite of products.

Find out more about all the new features in the last three Swarm upgrades, here, (link to PDF showing the last three versions)

Who can argue with better performance? Download your Swarm 2017.2 Upgrade Today!

Off

What to Do When JIRA Can't Handle Your Workflow Anymore

$
0
0
What to Do When JIRA Can't Handle Your Workflow Anymore
Thumbnail
dborcherding August 16, 2017
Application Lifecycle Management

Your developers like JIRA for bug tracking because it’s cheap and easy to use. 

You liked it, too, when you had a smaller team and a simple workflow.

But your team grew. Now you’re dealing with more stakeholders than just engineers.

And your workflow became more complex. Now there’s more to track than just bugs.

You have to manage requirements, test cases, and other development artifacts.

Even bug tracking — JIRA’s strength — is more difficult, now that they number in the thousands.

Worse yet, you need strong traceability, and JIRA can’t do it.

You feel stuck. You can’t dump JIRA — the developers would mutiny!

Good news: There’s a way to make JIRA fit your workflow without all the add-ons.

Making JIRA Fit a Complex Workflow

Whether Agile or Waterfall, your typical development project workflow has five stages: concept, feasibility, development, implementation, and production.

JIRA provides decent coverage of the last three, but can’t stretch to the concept and feasibility phases unless you incorporate add-ons.

Thumbnail
JIRA's coverage of a sample complex development workflow.

This exposes your project to risk and failures, which can have serious consequences:

  • Defects in the release, potentially causing harm to users.
  • Failure to pass a quality or regulatory audit, delaying time to market.
  • Product failure, wasting significant investment in the product’s development.

Stretching JIRA’s Coverage You need to extend JIRA’s coverage to the entire product development workflow. You could try to plug the holes with add-ons from the JIRA store, but that approach has problems, too:

  • It can double the cost of your JIRA investment, once you tally up all the additional license fees.
  • The setup and maintenance can be so complicated, you need to hire an outside consultant to get things running right.
  • It can create multiple points of failure if the add-ons aren’t updated when a new JIRA update rolls out.
  • And when things go wrong, you’re left wondering who to call for support. Atlassian? The add-on’s creator?

If Not Add-ons, Then What?

So if add-ons aren’t the answer, what can you do when JIRA doesn’t work for your workflow anymore?

You could jump to a new, more powerful tool, but you’d waste your JIRA investment, and tick off your development team.

What if you could stretch JIRA so that it could cover the entire product development workflow from the concept phase through the end of the production phase?

  • You’d have a centralized way to access and manage all the artifacts a project generates: requirements, test cases, issues, and other development artifacts.
  • All development artifacts could be automatically linked — from requirements to test cases to issues — giving you backwards and forwards traceability.
  • Stronger traceability would mitigate your quality and regulatory compliance issues.
  • Communication between stakeholders, developers, and QA would be simplified and streamlined.

Well, good news: by integrating JIRA with Helix ALM, you can gain all those benefits and more. With Helix ALM, you get complete coverage of your entire product development workflow.

Thumbnail
Helix ALM lets you extend JIRA to cover your entire workflow.

Helix ALM integrates with JIRA out of the box, with no extra licensing to buy. And Helix ALM is modular; you can buy only what you need.

Download “Beyond Bug Tracking with JIRA” to Learn More

Want to learn more about stretching JIRA’s coverage? Download our white paper, “Beyond Bug Tracking with JIRA,” to learn how Helix ALM integrates with JIRA for end-to-end coverage of even the most complex product development workflow.

On

Server-Side Google Analytics Event Tracking with Rails

$
0
0
Server-Side Google Analytics Event Tracking with Rails
Thumbnail
jpieper September 8, 2017
Reporting
Repository Management

As part of the signup and onboarding process improvements we're doing right now at Perforce, we're also trying to improve the usefulness of our metrics. One of the most important actions to track is user signups, and so we've been looking into ways of doing that accurately with Google Analytics.

Alternatives

A signup happens when a user fills and submits a form on our website. The form is processed by the website's Rails backend, and the user is redirected to Helix TeamHub itself if everything went OK. There are several approaches one could take to track something like this:

  • We could just look at new customers popping up in our CRM system. The problem with this is that the data can't be connected easily with any of the other data Google Analytics is collecting: Where do users come from? What do they do before they sign up?
  • We could track signups by triggering an event on the next page that follows a successful signup. In our case though, that path might be different for different users, and we don't want to have an extraneous "Welcome" or "Thank You" page interrupting the user flow, just to get some analytics recorded.
  • We could trigger an analytics event with JavaScript when the user submits the form. The problem with this is that the event delivery in Google Analytics is asynchronous, so we cannot be sure if the event was really recorded before the user's browser left the page (without resorting to some iffy setTimeout() trickery).

If you do some research (AKA Googling) around this problem, you'll find recommendations for all of these methods. For us, none of them felt right.

Universal Analytics And The Measurement Protocol

What we really want to do is send the event to Google Analytics from the server, since that seems to be the only option that's both reliable and unobtrusive to the user.

This used to be quite tricky with Google Analytics, but now they have a proper solution for it in their new Universal Analytics traking (currently in public beta): The Measurement Protocol.

From our perspective, the Measurement Protocol is basically nothing but an HTTP endpoint that receives Google Analytics tracking data. We can call it from our server-side code as long as we have the Analytics account information available.

Here is how we set it up for our marketing site - and how you can set it up for your Rails app or site:

1. Set Up A Universal Google Analytics Property

Unless your Analytics web property is already uses the Universal Analytics tracking method, you'll need to create a new web property. Most old properties use Classic Analytics instead, and that's still the default for new properties. You can see the type by navigating to the property in GA Admin, and opening the Tracking Info tab. If it says something like "Universal Analytics have been enabled", you're good to go.

If you do need to create a new property, just make sure you've selected the Universal property column on the creation screen:


Note that you'll also need to update the Google Analytics JavaScript tracking code on all your pages, so that your site will start gathering analytics to this new profile.

2. Set Up Google Analytics Configuration for Your Rails Application

After Step 1, your normal client-side tracking should already be fully functional. The rest of the article will be about setting up the server-side tracking in your Rails application.

First of all, let's put the Google Analytics configuration in its own YAML configuration file:

# config/google_analytics_settings.yml
production:
  endpoint: "http://www.google-analytics.com/collect"
  version: 1
  tracking_code: UA-12345678-9
  • We have one configuration entry per Rails environment. We're only really interested in production data so that's the only one we configure (you may also want to add a second entry for the development environment while you're setting this up).
  • We configure the Measurement Protocol endpoint and version, matching the values in the GA documentation
  • We define our Google Analytics tracking code. This should be the same as you have in your client-side JavaScript tracking snippet (the value beginning with UA).

Next, let's make a simple Rails initializer that makes this configuration available to our code at runtime:

# config/initializers/load_google_analytics_settings.rb
GOOGLE_ANALYTICS_SETTINGS = HashWithIndifferentAccess.new

config = YAML.load_file(Rails.root.join("config", "google_analytics_settings.yml"))[Rails.env]
if config
  GOOGLE_ANALYTICS_SETTINGS.update(config)
end
  • Here, we make the settings available in a global constant. It is initialized as an ActiveSupport HashWithIndifferentAccess, which means we will be able to access its keys either as Symbols or as Strings.
  • We load the YAML config file and look up the environment configuration that matches the current Rails environment. If there is one, we update our constant hash with its contents.

3. Add A Library Class for Invoking The Measurement Protocol

We want event tracking to be as simple as possible from our application's point of view, so let's make a library class that encapsulates all the details.

What we want is a method that sends an event to Google Analytics. To make this as simple as possible, we're going to include no more than a couple of things in the event:

  • The event category and action. These specify what the event is about, and you can use them later to associate the event with measurement goals.
  • The client id associated with the event. This will let you connect the event to all the other data you have about the same user's actions.

See the GA documentation for other kinds of data you could associate with the event.

Let's define a simple class with a method that takes these arguments. The method invokes the Measurement Protocol API in order to record the event. Here we are using the rest_client Gem, which makes HTTP calls ridiculously easy. (Be sure to add it to your Gemfile if you want to use it.)

# lib/google_analytics_api.rb
require 'rest_client'

class GoogleAnalyticsApi

  def event(category, action, client_id = '555')
    return unless GOOGLE_ANALYTICS_SETTINGS[:tracking_code].present?

    params = {
      v: GOOGLE_ANALYTICS_SETTINGS[:version],
      tid: GOOGLE_ANALYTICS_SETTINGS[:tracking_code],
      cid: client_id
      t: "event",
      ec: category,
      ea: action
    }

    begin
      RestClient.get(GOOGLE_ANALYTICS_SETTINGS[:endpoint], params: params, timeout: 4, open_timeout: 4)
      return true
    rescue  RestClient::Exception => rex
      return false
    end
  end

end
  • Line 5: The client_id argument is optional, with a default value of 555. This is a convention we picked up from the documentation.
  • Line 6: We skip the tracking if there's no tracking code in the configuration (which will be the case in development and test environments).
  • Lines 8-15: We construct the parameters for the API call, based on the method arguments and the global Analytics configuration
  • Lines 17-22: Here we make the actual API call to the Measurement Protocol. Note how we also set some timeout values so that the request won't be left hanging for too long if there's a network problem. We ignore any problems raised (by just returning false), so that a failing analytics call won't disturb other application behavior.

4. Pass The Analytics Client Id to Your Rails Actions

Before we're ready to call this new class from our controllers, there's one piece of data we need to pass from the web browser: This is the client id. It is an identifier Google Analytics assigns to each of your visitors, so that it can track their behavior over time.

Including the client id isn't strictly required (that's why we defined the default value 555), but it is highly recommended, because otherwise you won't be able to associate the server-side events with any other data you have in Google Analytics.

First, in all the forms that execute actions that you want to track - in our case, our signup forms - include a hidden form field for the Analytics client id:

<%= hidden_field_tag 'ga_client_id', '', :class => 'ga-client-id' %>

The value of the field is empty at first, because we won't know it before the Analytics JavaScript library has loaded. Instead, we will populate it from JavaScript.

The following snippet assumes you're using jQuery. Put it in a JavaScript file (or simply in a  tag in your HTML) somewhere after the Google Analytics JavaScript snippet.

{% codeblock app/assets/javascripts/ga.js %} $(document).ready(function() { ga(function(tracker) { var clientId = tracker.get('clientId'); $('.ga-client-id').val(clientId); }); }); {% endcodeblock %}

Our code is inside two callbacks: The first one is jQuery's document.ready, making sure that our page has loaded, and the second one is from Google Analytics, making sure it has initialized. In the code we simply get the current client id from the Google Analytics library, and put it as the value of any of those hidden form fields we might have on the page (identified by the CSS class).

5. Call the Analytics Client to Trigger An Event

That's it for all the setup! Now all we need to do is call our Google Analytics client from anywhere we want to track an event from. For example, we have something like this in the controller that handles signups:

# app/controllers/users_controller.rb
GoogleAnalyticsApi.new.event('billing', 'signup', params[:ga_client_id])

Finally, it is highly recommended you tuck these calls away in a background job, over Resque or one of its alternatives, so that you don't make a potentially slow and unreliable HTTP call to an external service during request processing.

When you've set everything up, you should start seeing these events in your Google Analytics reports. You can actually track them in real time, by navigating to Real-time -> Events in the Google Analytics web interface. You'll be able to see signups - all of them - fly past as they happen!

On
Viewing all 1361 articles
Browse latest View live


Latest Images